The Complete Guide to Setting Sales Goals (That Will Actually Move the Needle!)

The keys to leading effectively and driving rockstar team performance are clear, realistic goal setting and proactive coaching—all backed by hard data.

How to Set Goals for Your Sales Reps That Drive Results

Effective sales management begins with clear, realistic goal setting and proactive coaching—all backed by hard data.

But how exactly do you set realistic goals and why does it matter? What kind of metrics should you be trying to optimize? How can you collect and share relevant sales data to drive better business outcomes? And what can you do to make sure that you are setting the right goals and tracking them effectively?

If you’re wondering how to manage a sales team and instill the common characteristics found in high-performing sales teams, you’ve come to the right place. By the end of this guide, you’ll know the answers to each of these questions.

Download a PDF version of this guide by filling out this form, or keep scrolling to read.

Sales Goals

Chapter 1

Why Setting Goals Is Critical to Success

If you’re not measuring your efforts or seeking to achieve any specific, well-defined outcomes, how can you expect your sales team to knock it out of the park?

Why Setting Goals Matters

Most organizations set enormous, overarching goals: We want our product to be deployed across 20 percent of Fortune 1000 companies! While it’s helpful to have a north star, setting these monolithic goals can make it easy to overlook the granular steps needed to get there.

For example, a baseball team’s overarching goal might be to win the World Series. In order to do that, they need to score more runs than their opponents throughout the season. But runs don’t materialize out of thin air. They come from a combination of walks, hits, stolen bases, and home runs. When a baseball team focuses on optimizing each of those categories—think, “My goal is to be a .300 hitter this year” and “Let’s steal 10 percent more bases this year than we did last year”—the runs naturally follow.

How Goal Setting Drives Results

Goal setting drives sales results because—just like in the world of sports—sales professionals are incredibly competitive. The best reps are always focused on improving their performance. When you set goals and give each sales rep something to aim for, you increase the chances for them to achieve those milestones.

Once you set goals, you can begin to identify where sales reps are struggling. Imagine that hitter who’s eying a .300 batting average is in the middle of a slump. Upon examining the player’s performance over the last several games, the batting coach makes a critical observation: The batter, who’s left-handed, is early on fastballs, which is causing him to hit directly into the shift. By helping the player improve their timing and hit toward the opposite field, the slump breaks all of a sudden, and the batting average begins creeping back up.

Similarly, a sales manager notices a rep with lower opportunity (opp) creation efficiency is resulting in 50 percent fewer opps compared to peers, even though they have higher email activity. By identifying this weakness in performance, the manager knows which goals to set for the rep.

Chapter 2

Sales Metrics: Where the Magic Happens

In the information age where data moves at light speed, it’s easier than ever to track all kinds of sales team performance metrics over time—so easy that it can become overwhelming. But just because you can track a metric doesn’t mean you should. After all, there are only so many hours in the day that can be spent interpreting data. If you spend your time tracking too many metrics or tracking the wrong metrics, it’ll be that much harder to accomplish your ultimate goals. So, how do you select the best metrics to analyze?

How to Select Metrics: People, Performance, Priorities

Sales teams are made up of several different critical roles. The best sales leaders are able to successfully manage account executives (AEs), inbound sales development representatives (SDRs), outbound SDRs, account managers, and customer success managers, helping each of them achieve great results by understanding the six different types of sales goals:

  1. Monthly goals (e.g., closed deals per month)
  2. Waterfall goals (e.g., increasing the number of calls reach week in small increments to get to your desired goal)
  3. High-priority goals (e.g., closing deals is more important than making cold calls)
  4. Activity goals (e.g., if you need to convert 10 users over email and two users out of every 100 emails converts, send out 500 emails)
  5. Incentivized goals (e.g., getting paid more for making upsells)
  6. Stretch goals (e.g., increase revenue 10 percent each month)

Which Metrics to Set Goals By

While every organization is different, sales teams are often focused on maximizing the same metrics. While AE goals might be to optimize bookings, win rates, and average deal cycles, SDR goals might be more interested in pipeline generated, opps created, and opp acceptance rates.

Helping these folks accomplish their objectives starts with understanding the metrics that drive the desired outcomes. For example, SDRs looking to increase the pipeline need to focus on the behaviors that make that happen. These should include:

  • Contacts engaged
  • Talk time
  • Calls
  • Call connect rate
  • Touches per contact
  • Unique accounts touched

On the other hand, AEs looking to improve booking need to think about the following metrics: 

  • Opps owned
  • Pipelines owned
  • Meetings 
  • Accounts touched 
  • Emails

Any way you slice it, there are a ton of metrics to measure.

That said, just because you’re taking the next step in your sales transformation journey doesn’t mean you need to start from scratch. 

To give yourself a head start on the metrics your organization should prioritize, check out this handy sales metrics setting and publishing template.

How the Metrics Impact Outcomes

Of course, you want your SDR reps to generate more pipeline, and you want your AEs to rack up bookings. By targeting the right metrics and doing everything you can to fine-tune them, you’re optimizing the inputs of the equation—increasing the proven metrics needed to achieve the desired outcomes—which makes it that much easier to achieve your overall objectives.

While metrics can help you identify an AE or SDR that may not be pacing well, you can also use metrics to identify those that are outperforming. If you have an AE or SDR that is consistently crushing KPIs, be sure to utilize the data to pull out trends in their actions that may be attributing to their overachievement. You can then replicate these successes across the team!

Chapter 3

Data Collection: How to Get the Right Insights

It’s easier than ever before to collect data, but not all data has the same value. Getting your sales team to the next level starts with collecting relevant data that allows you to accurately capture the above metrics and use them to improve business outcomes.

What’s Useless and What’s Useful

Just because you can collect and measure any and all data doesn’t mean you should. When you collect the wrong data and report on it—or when you collect it and don’t leverage it for analytics purposes—you’re wasting precious internal company resources.

So, first things first: You need to make sure you’re tracking the right data. This includes:

  • Pipelines owned
  • Pipeline hygiene 
  • Untouched opportunities
  • Stagnant opportunities
  • Closed won
  • Closed lost

After that, you need to then decide whether you need to capture data manually or whether you can use tools to automate the data collection process. Chances are your organization already uses automation across a number of business functions. Unless you’re keen on wasting your team’s time on repetitive work, you are probably better off bringing the power of automation to your sales data collection activities.

How to Automate Data Collection

Once you’ve determined the quantity and quality of KPIs you’re going to track, it’s time to figure out how to automate as much of the process as you can. Luckily, most of the tools your sales team is already using should likely have data collection automation capabilities.

For example, sales engagement platforms such as SalesLoft, Outreach, Mixmax, and Groove enable teams to automatically route email, call, and meeting data into their CRM. Similarly, specific performance analytics tools such as Atrium also automate rep performance data collection, monitor KPIs, and provide root cause analysis.

Chapter 4

Visualizations: How to Make Sense of Data

Collecting vast amounts of data won’t do you any good if you’re unable to analyze and interpret it in real time. To transform into a truly data-driven sales team, you need to produce engaging and informative reports that help employees visually identify areas where they’re struggling before it’s too late to course-correct.

How to Watch the Performance Before Your Eyes

As you begin thinking about presenting data to your team, you should guide your efforts by thinking about each report as answering a specific question. How many opps have the SDRs created this month? How many emails did each SDR send last week?

Dashboards should have the same purpose. For example, a sales leader might say, “This dashboard is used during our weekly sales standup meeting to analyze the previous week’s performance.”

It’s also worth noting that sales teams need to enable multiple views per metric. Imagine one of your reps has fewer and fewer new opps coming into the pipe, and you’re only analyzing performance by total new opps per rep in the last 90 days. You won’t be able to notice this individual’s declining performance for several weeks.

If, however, you paired that metric with another metric—say, total opps in the pipe today per rep—you’ll visually see the decline and can take immediate action to uncover why.

Which Data Visualization Tools to Try

Most commonly, teams use one of these three solutions to create data visualizations:

  1. CRM reporting. While sales teams already have this technology in place, producing reports this way is time-consuming.
  2. Business intelligence. BI tools can create powerful, robust reports that leverage a variety of different data sources. That said, this approach is even more time-consuming than using the CRM; it can take as long as three months and require a lot of engineering and business analyst resources.  
  3. Data-driven management software. For most teams, purpose-built performance management software, such as Atrium, is the most sensible option. This solution delivers immediate results out of the box. It also has prebuilt reporting and visualization tools and automatically detects statistical anomalies that are sent straight to your inbox, saving managers from having to scrutinize the data themselves.

We might be just a tad bit biased here, but we believe that the third option is the best.

Data Visualization Examples

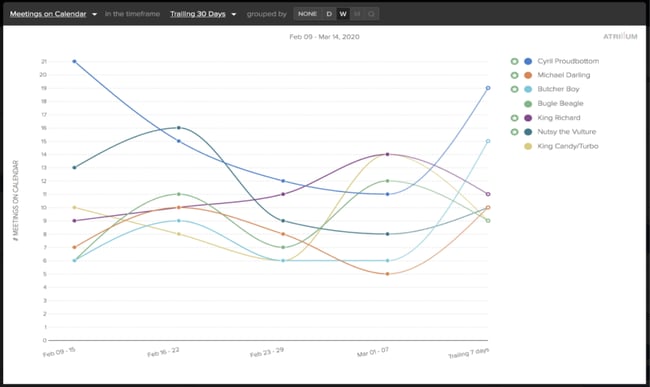
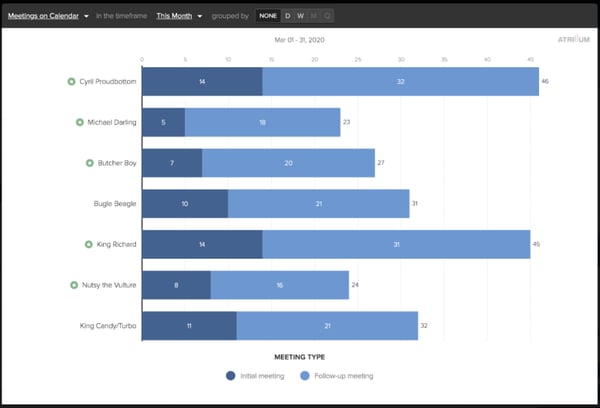
To give you a better idea of what this all looks like in action, take a look at some of these examples of data visualization of AE Core Activity.

atrium data viz ex-1

Customer Meetings By Rep, Trailing 30, By Week

Answers questions:

"Are we seeing any trends in meeting volumes that would be a cause for concern that we should address?"

"Are we seeing any high performance meeting volumes in reps that we want to replicate across the team?"

"Are we seeing the impact across the team of any initiatives that we are conducting to raise meeting volumes?"

atrium data viz ex-2

Customer Meetings by Rep, This Month, Totaled

Answers questions:

"Is there any rep that appears to be lagging on customer-facing meetings this month that would cause concern and that we should address?

"Is there any rep that appears to be outperforming in a way that we could replicate across the rest of the team?"

Chapter 5

Distribution and Monitoring: How to Share Your Data

At this point, you’ve collected all your data, and you’ve also put together stunning reports and visualizations. Now, to unlock the full value of all of that, you need to determine the best ways to share that information with your team.

Keeping Data Distribution Simple 

Let’s be honest: Do you really think that your overworked team members are going to go out of their way to hop into yet another platform to consume reports and glance at dashboards?

In order to get the results you’re hoping for, you need to work to democratize this information across the sales team. You can do that by bookmarking relevant URLs, adding said URLs to calendar meeting invites, and even creating nonmeeting events that remind folks to take a look at a certain time. You can also broadcast metrics across relevant channels (e.g., Slack), display them on TVs throughout the office, and embed links in recurring meeting agenda documents.

In purpose-built sales performance solutions such as Atrium, you can also configure the software to automatically send out alerts when certain metrics move in a statistically significant manner. That way, you’ll know immediately when issues are occurring.

Data Distribution Examples

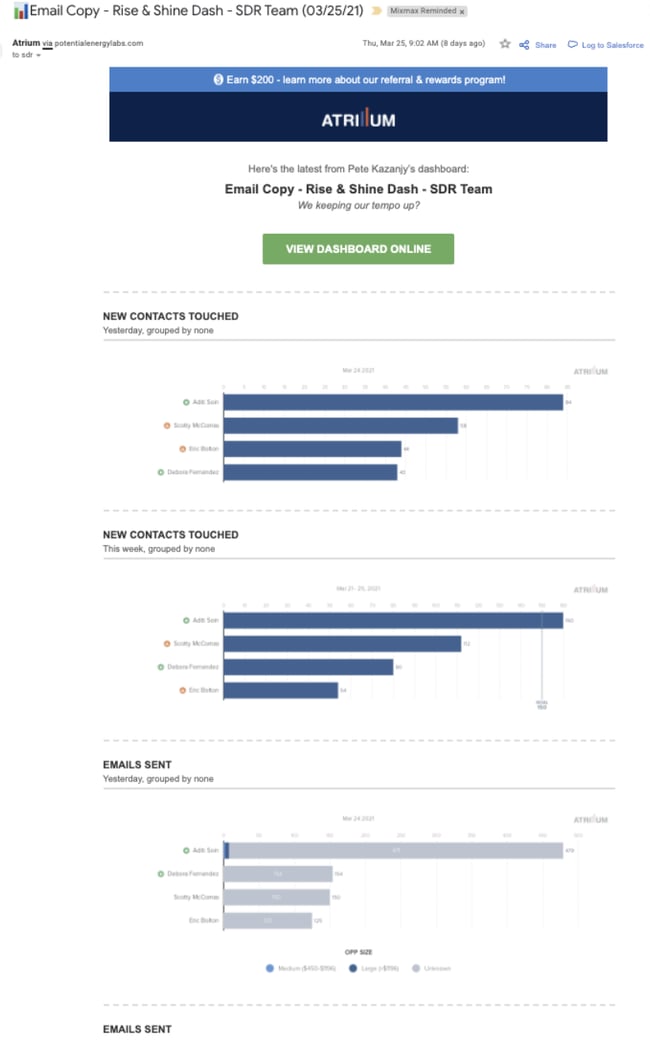
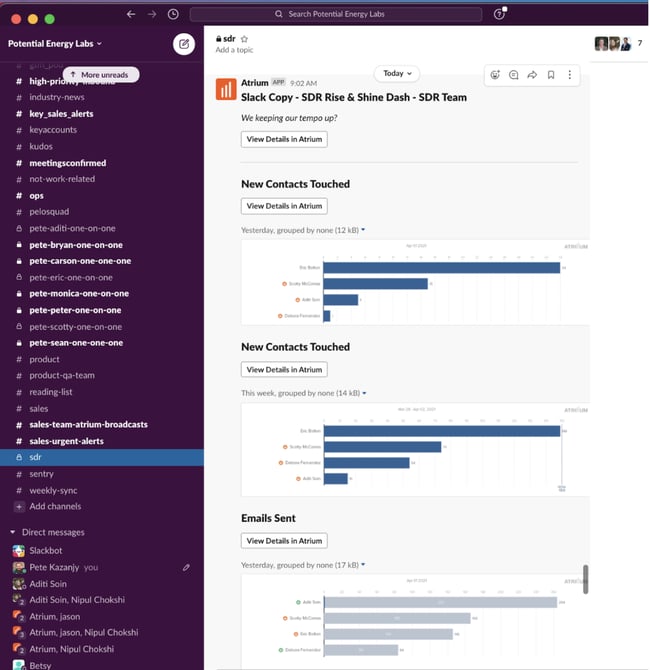
Check out how easy it can be to distribute metrics using meeting calendar events, email, and messaging tools:

metrics distribution ex-1

Metrics Distributed Via Email

metrics distribution-1

Metrics Distributed Via Slack

Distributing and Consuming Data: The Ideal Cadence

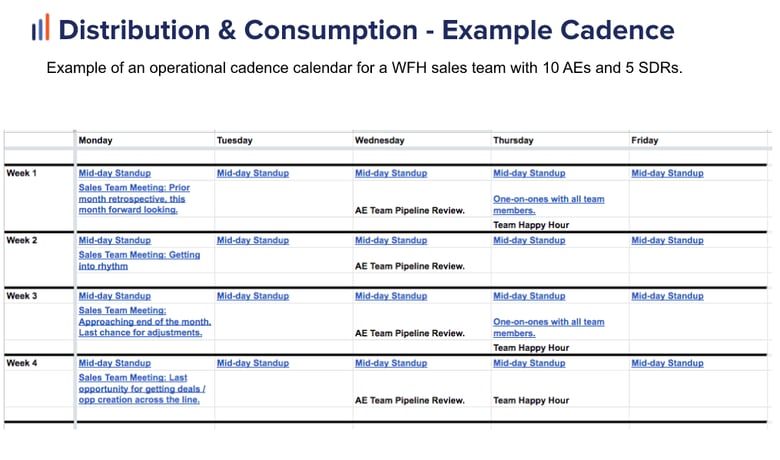
Distributing your reporting and visualizations is one thing. Getting your team to consume them is quite another. The best way to do this is via a good old-fashioned meeting. In some cases, you might want to meet with the entire team. In others, you might want to have regular one-on-ones with each rep to check in with them, track their progress, and give them the coaching they need to get to the next level.

While no two sales teams are exactly the same, here’s an example cadence that should help get you thinking in the right direction:

atrium-pp

Chapter 6

How to Create New Baselines

Whether you’re transforming your sales team with new technology or your organization has been impacted by external factors, there will come a time when you need to create new baselines because the old ones are no longer guiding your efforts.

Figuring Out New Baselines

Determining your new baselines starts with figuring out “the new normal” for inputs and outputs. Unfortunately, this isn’t always something that you can take care of overnight. In some instances, it might take as long as six months to really see the full picture. 

By using sales performance monitoring tools such as Atrium, you will be able to keep track of how your team is performing during this transition to the new normal. Armed with that information, you can create new KPIs and track performance against them.

Important Metrics to Inform Setting New Baselines

Here are three things to keep in mind as you begin creating new baselines:

  1. The size of your team. The bigger your team, the faster you’ll be able to see statistically significant changes.
  2. The speed of your sales cycle. If your sales motion is faster, you’ll see what the new normal is sooner.
  3. Precursor metrics. Keep your eye on these metrics (e.g., SDR email response rates, which are a leading indicator to meeting and opp creation). They will begin telling the story sooner than output metrics.

Chapter 7

How to Troubleshoot Your New Data-Powered Sales Team

By now, you’ve more or less transformed your entire operation. You’ve selected new metrics, set goals, created visualizations, and made sure they were shared across the entire team. But how can you tell whether your approach is 100 percent effective or whether you made any errors in your processes?

Troubleshooting: Don’t “Set It and Forget It”

No matter how good your approach has been, know that it can always improve. Best practices call for periodically reviewing your system to make sure it’s as effective as it can be. Remember, this is all a fluid work in progress, and making a few tweaks can make a huge impact on how you consume the data.

Identifying and Diagnosing Issues 

As you begin troubleshooting your process, you’ll want to follow these four steps:

  1. Detect: Take a look at the visualizations you’ve put together and look for anything that stands out. For example, maybe a top performer is suddenly not doing so well anymore.
  2. Diagnose: Once you’ve detected an issue, you need to diagnose the problem. If an SDR is struggling to create enough opps, go upstream and inspect the quantity and quality of their activities.
  3. Communicate: At this point, you’ve identified the issue and figured out why it might be happening. Now it’s time to share this information with the employee in question, preferably in a cadenced one-on-one meeting.
  4. Loop back: Your job isn’t done quite yet. Put a reminder on your calendar and double-check your work to make sure you’ve actually solved the problem.

Implementing Performance Improvement Plans

Unfortunately, even if you’re the most effective sales leader in the world, the above approach won’t always work flawlessly. From time to time, you may have to put underperforming reps on formal performance improvement plans (PIPs) to give them a well-structured document that clearly articulates the behaviors they should change and what the expected outcomes are.

For many managers, giving performance feedback is hard. We hope we've made it a little easier. To get a better idea of what a PIP should look like, check out this template.

Chapter 8

Resolution: How to Resolve Issues

After you’ve completed the troubleshooting process, you’ll need to study your outcomes over time to see how your changes have impacted business results. By analyzing historical data, you can access trended views that show how your results have changed over time.

Identifying Goal Resolutions

Luckily, you don’t have to reinvent the wheel here. For example, if you set a goal for your sales reps to send out 100 emails per week and see someone only sent out 88 emails, you need to focus on improving those numbers. Similarly, if there are 53 untouched opps and your goal is to have 15, you’ll need to prioritize pipe management.

Making Goal Resolution Easy

By investing in dedicated performance analysis software such as Atrium, you get the peace of mind that comes with knowing that anomalies will be detected automatically. As a result, areas of interest will come to your attention as they emerge. For example, you might compare a rep against their peers or a rep against their past performance when an issue materializes.

Of course, sales activity management technology by itself isn’t a panacea. In addition to collecting the metrics and setting goals, you need to do everything you can to make sure your team achieves them. One of the easiest ways to do this is by holding regular one-on-one data-driven rep coaching meetings on a regular cadence. By doing so, you can implement a true data-driven sales approach that encourages your team to achieve more and more every day. 

And that’s the ticket to a happier team, happier customers, and a healthier bottom line.

Chapter 9

Bonus: Take a Deeper Dive into Data-Driven Sales Management and Setting Goals

Ready for more? To continue your learning and continue optimizing your sales process, check out our "Setting SDR & AE Goals That Don’t Suck!” masterclass.

Frequently Asked Questions

What is a sales activity goal?

A sales activity goal measures the activity of a sales representative. Staying on track with these goals will help sales reps hit their sales goals for the time period.

An example is if you need to convert 10 users over email and two users out of every 100 emails converts, the activity goal would be to send out 500 emails.

What are the benefits of goal setting?

Setting goals for your sales team is critical for success. Consider establishing large-scale business goals, along with smaller goals that are more specific and will help achieve the larger goal. Goal setting helps drive sales results because giving sales representatives something realistic to work towards helps them stay on track and increases the chances of them achieving those milestones.

What are some examples of sales goals?

Some examples of sales goals include:
1. Hit 2 million dollars in sales by the end of the fiscal year
2. Host 10 sales events in the month of January
3. Identify 100,000 new leads in Q1
4. Make contact with 50 clients by the end of the week
5. Sell 50,000 product units as a team by the end of Q2

How do you set a measurable sales goal?

Sales goals that are specific and measurable are more likely to be achieved. Set measurable sales goals by including precise metrics that you can measure, like sales amounts or emails sent, along with established timeframes.

What are SDR metrics?

Sales Development Reps (SDR) metrics help businesses quantify the contributions and impact of your sales development team. These goals are important to track to make sure SDRs are performing in alignment with your overall sales goals and industry benchmarks.

What are waterfall metrics?

Waterfall metrics are metrics that fall into a sequence, moving from one phase to the next. They often measure things like process and productivity, ensuring that the designated workflow is being followed.

How do you measure sales rep performance?

The best way to measure sales rep performance is to:
1. Choose the right leading indicator metrics in addition to lagging indicator metrics
2. Identify the right behaviors to improve based on what these metrics are telling you
3. Set goals against key metrics to drive changes in behavior.

close chapters modal

Want a PDF version of this guide? 

Simply fill out this form to receive a PDF version of our guide.

Sales Goals